Economy Output per hour – the Office for National Statistics' (ONS) main measure of labour productivity – fell by 0.1% in Quarter 2 (April to June) 2017. This compares with a fall of 0.5% in Quarter 1 (January to March) 2017, as presented in Figure 1. As a result, labour productivity remains at around the same level as its pre-downturn peak. The fall in productivity in Quarter 2 was the result of slower gross value added (GVA) growth (using the preliminary gross domestic product (GDP) estimate) relative to the increase in total hours worked, which was driven predominantly by growth in employment (using the latest Labour Force Survey data). This flash estimate of UK productivity uses the first available information on output and labour input for the quarter. These data may be revised in subsequent months. As such, ONS releases the more detailed Productivity Bulletin after the third estimate of GDP for the quarter is published, which will be consistent with the quarterly national accounts. 
The UK unemployment rate fell to 4.4% in the 3 months to June 2017 – the lowest it has been since 1975. The employment rate reached a new record high of 75.1%. Real average weekly earnings fell by 0.5% in the 3 months to June 2017, both excluding and including bonuses as consumer price inflation continued to outpace growth in wages. The inactivity rate fell to a new record low of 21.3%. Among the inactive women, the proportion of those who are students reached a record high of 21.1%.
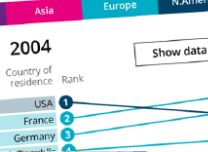
Estimates from the Labour Force Survey show that, between January to March 2017 and April to June 2017, the number of people in work increased, the number of unemployed people fell, and the number of people aged from 16 to 64 not working and not seeking or available to work (economically inactive) also fell. There were 32.07 million people in work, 125,000 more than for January to March 2017 and 338,000 more than for a year earlier. This article presents an analysis of the number of UK and non-UK people, by both nationality and country of birth, who were employed, unemployed and economically inactive in the UK. This article contains charts that compare the Labour Force Survey (LFS) headline 3-month average rates for employment, unemployment and economic inactivity with their equivalent single month estimates. The single month estimates are derived from the same data source as the headline 3-month figures but are not designated as National Statistics and their use is restricted to helping to understand the movements in the headline 3-month averages. This article presents two analyses of the average weekly earnings (AWE) figures, which are published in the UK labour market statistical bulletin. These analyses are updated every month. The first section describes real AWE, which is AWE deflated by the Consumer Prices Index including owner occupiers' housing costs (CPIH). The second section analyses single month movements in the nominal AWE. Regional, local authority and parliamentary constituency breakdowns of changes in UK employment, unemployment, economic inactivity and other employment-related statistics. | 


No comments:
Post a Comment