| If this is a 'post-truth' era, when was the 'truth' era? That was one of the questions posed at a recent panel discussion hosted by the Royal Statistical Society to consider whether we really are in a post-truth world of 'alternative facts', and if so what we can do about it. Find out more in our latest blogpost. This week the Guardian carried an interesting report on the process of compiling all the prices needed to calculate inflation. Find out more and read the full article.  We've launched a recruitment campaign to boost the number of Data Analytics Apprentices across Government. If you have missed the government drive to increase apprentices across all sectors and industries then you may have missed the slogan "get in, go far". Gareth Clancy explains how you can get in and go far as an apprentice at ONS. Think apprenticeships might be for you and want to know more? Get in touch at apprenticeships@ons.gov.uk. How much do you think your household spends every week? Average weekly household spending varies by as much as £228 across the UK. Find out what it's like in your area and see how it compares with the rest of the UK. 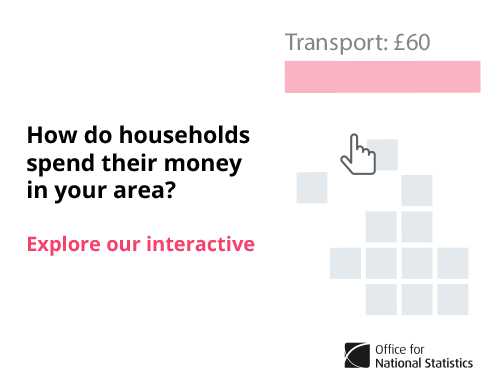 How much do households spend per week and what do we spend it on? Do we spend more per week on bananas or apples? Which region spends the most on pets and pet food? Explore spending habits across the UK and the data behind Family Spending with our interactive. 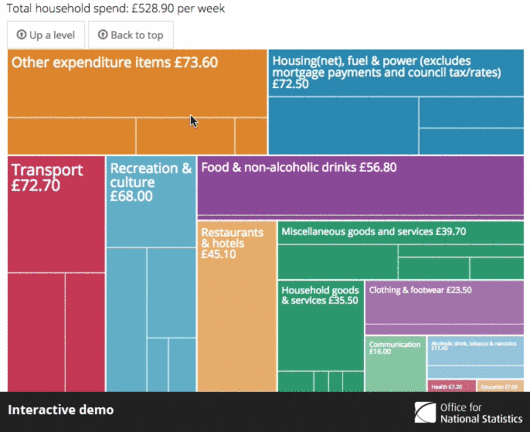 | 


No comments:
Post a Comment