Economy UK index of services: May 2017
Services output increased by 0.2% between April and May 2017.
The largest contribution to the month-on-month growth came from business services and finance, which contributed 0.23 percentage points.
In the 3 months to May 2017, services output increased by 0.4% compared with the 3 months ending February 2017, with all four main components increasing. Monthly economic commentary: July 2017
The preliminary estimate of gross domestic product (GDP) indicated that the UK economy grew by 0.3% in Quarter 2 (Apr to June) 2017, following growth of 0.2% in the previous quarter.
UK economic growth in Quarter 2 2017 was driven by the services sector, while production and construction acted as a drag.
The core Consumer Prices Index including owner occupiers' housing costs (CPIH), which excludes energy, tobacco, food and alcoholic drinks, has been rising in recent months, although it fell back 0.1 percentage points in June. UK GDP, preliminary estimate: Apr to June 2017 UK gross domestic product (GDP) was estimated to have increased by 0.3% in Quarter 2 (Apr to June) 2017.
The growth in Quarter 2 2017 was driven by services, which grew by 0.5% compared with 0.1% growth in Quarter 1 (Jan to Mar) 2017.
The largest contributors to growth in services were retail trade, which improved after a fall in the first quarter, and film production and distribution. 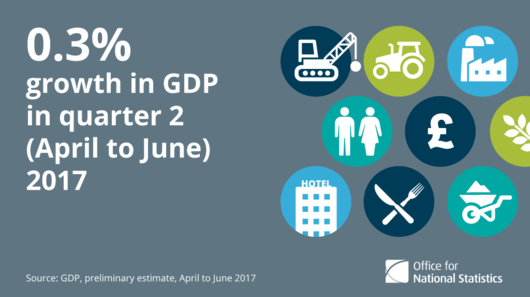 Employment and labour market Workless households by region, UK: 2016
In 2016, the areas with the highest percentage of workless households were generally located outside the south of England.
However, not all locations outside the south of England had high percentages of workless households; 8 of the 50 areas with the lowest in 2016 were in Scotland, Wales, the Midlands and the north of England.
Hartlepool, North Ayrshire and Inverclyde were in the five areas with the highest percentage of workless households in both 2015 and 2016. We are reviewing the relationship question for the 2021 Census. Get involved and take part in our online card sorting exercise. Over the last few weeks, thousands of civil servants took part in the government's largest cross-department learning event Civil Service Live. Head of ONS's Big Data Team Owen Abbott explains how we have been showcasing the benefits of data science skills to improve outcomes for the public. | 


No comments:
Post a Comment