Economy Services output increased by 0.5% in Quarter 2 (Apr to June) 2017 compared with Quarter 1 (Jan to Mar) 2017; following growth of 0.1% between Quarter 4 (Oct to Dec) 2016 and Quarter 1 2017.
The largest contribution to quarterly growth came from the transport, storage and communication sector, which contributed 0.17 percentage points; the largest industry contribution came from retail sales, which contributed 0.11 percentage points.
The Index of Services increased by 0.4% between May and June 2017. The second estimate of gross domestic product (GDP) shows that the UK economy grew by 0.3% in Quarter 2 (Apr to June) 2017, unchanged from the preliminary estimate of GDP published on 26 July 2017.  UK gross domestic product (GDP) in volume terms was estimated to have increased by 0.3% between Quarter 1 (Jan to Mar) and Quarter 2 (Apr to June) 2017, unrevised from the preliminary estimate.
In the output measure of GDP, growth was driven by services, which grew by 0.5% between Quarter 1 and Quarter 2. Gross fixed capital formation (GFCF), in volume terms, was estimated to have increased by 0.7% to £79.4 billion in Quarter 2 (Apr to June) 2017 from £78.9 billion in Quarter 1 (Jan to Mar) 2017. Business investment was estimated to have been broadly unchanged at £43.8 billion in Quarter 2 2017 at 0.0%. Employment and labour market There were 790,000 young people (aged 16 to 24) in the UK who were not in education, employment or training (NEET), a decrease of 10,000 from January to March 2017 and down 56,000 when compared with April to June 2016. The percentage of all young people in the UK who were NEET was 11.1%, down 0.1 percentage points from January to March 2017 and down 0.6 percentage points from April to June 2016. People, population and community Net long-term international migration was estimated to be +246,000 in year ending (YE) March 2017, down 81,000 from +327,000 in YE March 2016; immigration was 588,000, down 50,000, and emigration was 342,000, up 31,000 (all statistically significant changes). 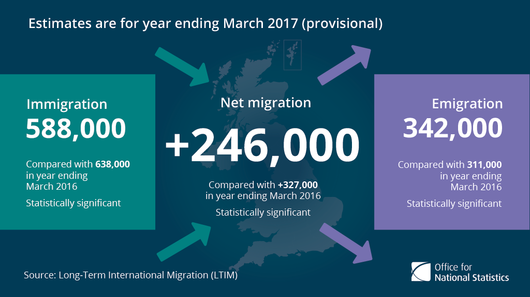 Of the usually resident population in the UK, around 1 in 7 (14%) were born abroad and 1 in 11 (9%) had non-British nationality in 2016. Non-UK populations continued to increase between 2015 and 2016; the non-UK born population from 8.6 million to 9.2 million (up 7%) and the non-British population from 5.6 million to 6.0 million (up 8%) (both statistically significant changes). The increase in non-UK born residents was driven by statistically significant increases in both EU and non-EU born residents; the statistically significant increase in the non-British population was driven by EU nationals alone (the number of non-EU nationals in the population has remained stable). Over a quarter (28.2%) of live births in England and Wales in 2016 were to women born outside the UK, the highest level on record. Since the 1990s, immigration for study by long-term migrants (those who stay for a year or more) has more than doubled from 56,000 (+/- 10,000) in 1991 to 136,000 (+/-18,000) in 2016. Much of this increase has happened since the early 2000s, reaching a peak of 238,000 (+/- 17,000) in 2010. Since then, immigration for study has fallen. Interactive product bringing together different migration related data sources at local authority level. | 


No comments:
Post a Comment