Economy UK index of services: Aug 2017
In the three months to August 2017, services output increased by 0.4% compared with the three months ending May 2017.
Computer programming and retail trade made the largest contributions to the three-month on three-month growth; contributing 0.10 and 0.08 respectively.
The Index of Services increased by 0.2% between July and August 2017. UK GDP, preliminary estimate: July to September 2017
UK gross domestic product (GDP) was estimated to have increased by 0.4% in Quarter 3 (July to Sept) 2017, a similar rate of growth to the previous two quarters.
Services increased by 0.4%, the same rate as Quarter 2 (Apr to June) 2017 and remains the largest contributor to GDP growth, with a strong performance in computer programming, motor trades and retail trade.
Manufacturing returned to growth after a weak Quarter 2 2017, increasing by 1.0% in Quarter 3 2017. Monthly economic commentary: October 2017
The preliminary estimate of gross domestic product (GDP) shows that the UK economy grew by 0.4% in Quarter 3 (July to Sept) 2017, following growth of 0.3% in the previous quarter.
Growth in Quarter 3 2017 was driven by an expansion in production and services output, while construction continued to act as a drag.
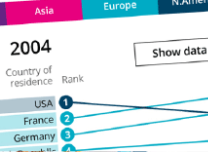
London has seen weaker average house price growth than the UK as a whole since December 2016, partly due to a fall in the average level of transactions. We're marking the 60th birthday of The Today Programme on BBC Radio 4 by looking at what's changed in the UK since 1957.  Test your knowledge of changes in house prices, divorce, how long we live for, and how many of us were born abroad in our latest article.  Listen to our statistician Liz McLaren and Director of Data Collection Pete Benton on BBC Radio 4's Today Programme as they discuss what's changed in society in 60 years (2:53:20). | 


No comments:
Post a Comment