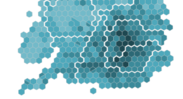
Economy House price per square metre and house price per room, England and Wales: 2004 to 2016 Annual data on house price by size of property calculated using data from HM Land Registry and Valuation Office Agency. Homes in the most expensive area of England and Wales cost 25 times as much as in the cheapest area, according to ONS analysis of 2016 property prices. One square metre of floor space – an area about the size of a red phone box – costs almost £19,439 in Kensington and Chelsea, while in Blaenau Gwent in the South Wales valleys, the same amount of space costs £777. Our article compares property prices by floor space across England and Wales and the value of floor space for your local authority area.  People, population and community Living abroad: dynamics of migration between the UK and the EU2
In 2016, there were 413,000 EU2 citizens resident in the UK – the majority (79%) of these were Romanian.
Analysis of data from 2014 to 2016 estimates 81% of EU2 citizens resident in the UK were aged between 16 and 64 years old.
The construction and the distribution, hotels and restaurants industries were popular employers of EU2 citizens resident in the UK between 2014 and 2016, each employing 23% of EU2 citizens. Population statistics research update: October 2017 This article describes the research and development planned for our standard population statistics outputs as at October 2017. To help users quickly find the information they need, the article includes a description of each project similar to that provided in the previous research update in June 2017, followed by an update paragraph on progress since June. When it comes to statistics, randomness matters New on our National Statistical blog: "Without randomness, we would know a lot less than we do now." Deputy National Statistician Jonathan Athow explains why random selection makes for better statistics. "If you have been selected at random, we need you to fill in the survey to help the randomness do its work". Read our latest blogpost to find out more. | 


No comments:
Post a Comment