Friday, July 7, 2017

Global Hazards Weekly Bulletin - 03 to 07 July 2017

Global hazards weekly bulletin

Global Hazards Weekly Bulletin – 03rd to 07th June 2017

China

5 killed, 19 injured in mudslide in China

Tens of Thousands Evacuated as Deadly China Floods Burst Rivers' Banks

At least 42 killed as torrential rain sweeps central and south China

5 killed, 19 injured in mudslide in China

Floods in more than 60 rivers claim lives in south China as north wilts

Nine confirmed dead in central China landslide

Heavy rains lash China; 56 killed, 27,000 houses collapse in floods, landslides and hailstorms


India

Heavy rains cause flood-like situation in various parts of country

Torrential rain triggers flash flood in Manipur

Torrential rain triggers flash floods in Manipur, over 300 homes affected

Heavy rains in Manipur, Arunachal trigger flash floods, 4 deaths in Rajasthan

In few days, Gujarat gets 24% of monsoon rain: 32 dead in rain-related incidents

Several lakhs displaced as rain lashes NE


Indonesia

10 Injured as Volcano Erupts on Indonesia's Java Island

Rescue helicopter crash kills eight after Indonesian volcano erupts

Aid helicopter crash kills 8 after Indonesian volcano erupts


Japan

Rivers flood, thousands evacuated as heavy rain hits western Japan

Japan hit by torrential floods as 400,000 people are forced to leave their homes

Six confirmed dead in Kyushu deluge as search for missing continues


Pakistan

Week of monsoon rain, floods claim 43 lives in Pakistan


Portugal

Forest fires injure 9 firefighters in Portugal, 2 seriously


Other items of interest

Jharkhand records 38% less monsoon rain in June

"We cannot end poverty without science and technology"- Prof Frimpong Boateng

Why community medicine (public health) is the sexiest profession of the 21st century

State Farm receives more than 5,000 claims linked to last week's hailstorm

The IAEA's Role in Disaster Risk Reduction Law

UNICEF and the European Union strengthen the resilience of 700,000 children to cope with natural disasters in Central Asia and the South Caucus

NASA detects drop in global fires

Mapped: How climate change affects extreme weather around the world

World Bank launches first-ever pandemic bonds to support $500 million pandemic emergency financing facility

Making development more resilient through risk information in Afghanistan

New global action programme for SIDS countries addresses nutrition and climate change challenges

WHO guidelines on ethical issues in public health surveillance


This email was sent using GovDelivery Communications Cloud on behalf of: Public Health England (PHE), Wellington House, 133-155 Waterloo Road, London SE1 8UG 020 7654 8400 GovDelivery logo

Food supply of the future – world premiere of the Antarctic greenhouse EDEN-ISS

DLR German Aerospace Center
- Web Portal News -

Food supply of the future – world premiere of the Antarctic greenhouse EDEN-ISS


Global food production is one of the key societal challenges of the 21st century. A growing world population with the simultaneous upheaval caused by climate change demand new methods of cultivating crops in regions with unfavourable climates. A closed greenhouse is a good way of growing food in deserts and low-temperature regions – as would be the case on missions to the Moon and Mars – as it permits harvesting regardless of the weather, the Sun and specific seasons. In a closed greenhouse, water consumption is immensely reduced and there is no need for pesticides and insecticides. This kind of model greenhouse will set off for the Antarctic at the end of 2017 for a year of long-term testing under extreme conditions as part of the EDEN-ISS project. Unparalleled elsewhere in the world, this Antarctic greenhouse was presented to the public for the first time at the Bremen site of the German Aerospace Center (Deutsches Zentrum fuer Luft- und Raumfahrt; DLR) on 7 July 2017.


Full article with images: http://www.dlr.de/dlr/en/desktopdefault.aspx/tabid-10081/151_read-23159/year-all/#/gallery/27431

Stay up to date - Follow us on Twitter, Facebook and YouTube:

http://www.twitter.com/dlr_en
http://facebook.com/DLRen
http://youtube.com/dlrde

For updates in German:
http://www.twitter.com/dlr_de
http://facebook.com/DLRde

100 days since the Data Science Campus officially opened, and Happy World Chocolate Day!

Logo

View in browser

7 July 2017


Data Science Campus: the first 100 days

It's 100 days since the Data Science Campus officially opened its doors to help ONS and government meet the challenges of understanding the modern economy and society. MD Tom Smith reflects on the successes and challenges of the last 3 months and what's in store for the future. 

Read the blogpost


Happy World Chocolate Day!

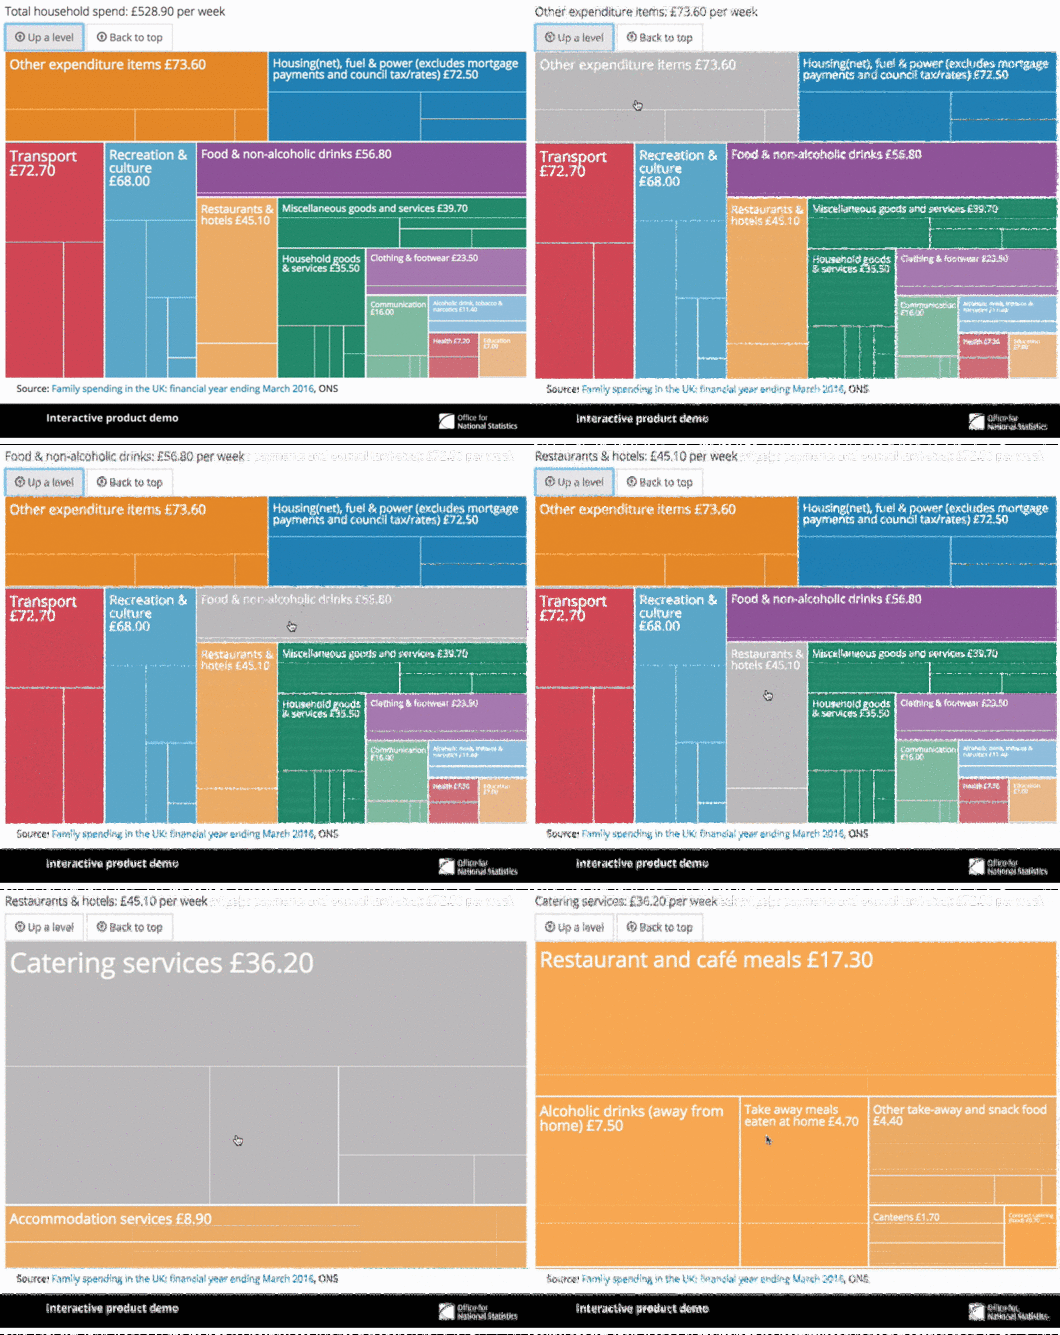
Did you know that on average, households spend more on chocolate in a week than tea and coffee combined? Northern Ireland spends the most on chocolate per week (£2.30), while Scotland spends the least (£1.80). How do you compare? Explore our interactive looking at household spending across the UK.  

fam spending gif

Explore Family Spending across the UK

Our digital team regularly write about our approach and progress to the website and social media.

Visit our Digital Blog

National Statistical is our corporate blog. It's the place to find insight into the role data plays in the decisions affecting our lives, the changes we are making to take advantage of it and the ways we keep it secure. 

Visit our Corporate Blog

local map from website

Looking for local statistics?

A handy guide to let you know where to find local statistics.

Census logo

Census

Discover how our census statistics help paint a picture of the nation and how we live.

visual promo image

Visual.ONS

Visual.ONS is a website exploring new approaches to making ONS statistics accessible and relevant to a wide public audience.


This email was sent using GovDelivery Communications Cloud on behalf of: Office for National Statistics · Room 1.101 · Government Buildings · Cardiff Road · Newport · South Wales · NP10 8XG · 0845 601 3034 GovDelivery logo

ONS releases - UK trade: May 2017, UK index of production: May 2017, Construction output in Great Britain: May 2017, and 100 days since the Data Science Campus officially opened

Logo

View in browser

7 July 2017

Business, industry and trade

Turnover in production and services industries: May 2017

Current price turnover figures for production and services industries.

Construction output in Great Britain: May 2017

Construction output fell in May 2017 by 1.2%, in both the month-on-month and 3 month on 3 month time series.

The 3 month on 3 month decrease represents the largest 3 month on 3 month fall in output since September 2012, driven by falls in both repair and maintenance, and all new work.

The main downward pressure on month-on-month growth came from all new work, most notably from infrastructure, which fell 4.0% following strong growth in April 2017.


Economy

Short-term indicators economic commentary: July 2017

A summary of the short-term indicators published in early July 2017.

UK trade: May 2017

Between the 3 months to February 2017 and the 3 months to May 2017, the total UK trade (goods and services) deficit widened from £6.9 billion to £8.9 billion.

The widening of the trade deficit in the 3 months to May 2017 reflects a higher rise in imports than the rise in exports of goods, in particular transport equipment (cars, aircraft and ships), oil and electrical machinery from non-EU countries; a decrease in exports of services also contributed.

UK index of production: May 2017

In the 3 months to May 2017 compared with the 3 months to February 2017, the Index of Production was estimated to have decreased by 1.2%, due mainly to falls of 1.1% in manufacturing and 3.5% in energy supply.

The largest contribution to the fall in manufacturing came from the highly volatile pharmaceutical industry along with a range of other industries while the fall in energy supply was due largely to warmer temperatures.


Data Science Campus: the first 100 days

It's 100 days since the Data Science Campus officially opened its doors to help ONS and government meet the challenges of understanding the modern economy and society. MD Tom Smith reflects on the successes and challenges of the last 3 months and what's in store for the future. 

Read the blogpost


And finally...Happy World Chocolate Day!

Did you know that on average, households spend more on chocolate in a week than tea and coffee combined? Northern Ireland spends the most on chocolate per week (£2.30), while Scotland spends the least (£1.80). How do you compare? Explore our interactive looking at household spending across the UK.  

fam spending gif

Explore Family Spending across the UK

Our digital team regularly write about our approach and progress to the website and social media.

Visit our Digital Blog

National Statistical is our corporate blog. It's the place to find insight into the role data plays in the decisions affecting our lives, the changes we are making to take advantage of it and the ways we keep it secure. 

Visit our Corporate Blog

local map from website

Looking for local statistics?

A handy guide to let you know where to find local statistics.

Census logo

Census

Discover how our census statistics help paint a picture of the nation and how we live.

visual promo image

Visual.ONS

Visual.ONS is a website exploring new approaches to making ONS statistics accessible and relevant to a wide public audience.


This email was sent using GovDelivery Communications Cloud on behalf of: Office for National Statistics · Room 1.101 · Government Buildings · Cardiff Road · Newport · South Wales · NP10 8XG · 0845 601 3034 GovDelivery logo