| How properly to measure the impact of digital technology is a big challenge for statisticians and economists the world over. Media reports have suggested that historic mismeasurement of the telecoms sector means that the UK's recent economic history will have to be significantly rewritten. As ONS Deputy Economist Richard Heys explains, it really isn't as simple as that. Business, industry and trade Commenting on today's retail sales figures, ONS senior statistician, Rhian Murphy said: "Retail sales continued to grow in the last three months of the year partly due to Black Friday deals boosting spending. Consumers continue to move Christmas purchases earlier with higher spending in November and lower spending in December than seen in previous years. "However, the longer-term picture is one of slowing growth, with increased prices squeezing people's spending. "Over the year the proportion of internet spending is continuing to rise, with almost one in every five pounds spent online by the end of 2017."  In the latest three months the quantity bought in retail sales increased by 0.4% compared with the previous three months; while the underlying pattern remains one of growth, this is the weakest quarterly growth since the decline of 1.2% in Quarter 1 (Jan to Mar) 2017.
On the month, the quantity bought decreased by 1.5% when compared with strong sales in November 2017.
In December 2017, the quantity bought increased by 1.4% when compared with December 2016, with positive contributions from all stores except food stores.
For the whole of 2017, the quantity bought in retail sales increased by 1.9%; the lowest annual growth since 2013.
In non-seasonally adjusted terms, shopping for Christmas has shifted in recent years from being mainly in December to more in November as consumers seem to be starting their purchasing earlier in line with Black Friday promotions.
Internet sales continued to increase when compared with previous years, with physical stores dominating online sales growth in December. This bulletin presents quarterly estimates of UK trade in services statistics by 54 countries; these statistics are based on information collected from the quarterly International Trade in Services (ITIS) survey and statistics for the first three quarters of 2017 are presented.
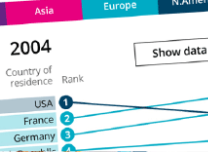
The European Union (EU) remained the UK's largest trading partner for both exports and imports of services in Quarter 3 (July to Sept) 2017, while the US was the largest trading partner when considering individual countries.
UK exports of services decreased from £39,438 million to £37,970 million between Quarter 2 (Apr to June) 2017 and Quarter 3 2017, reflecting falls amongst all regions except the EU, where exports rose.
Asia was the largest contributor to the overall £1,468 million decrease in UK services exports in Quarter 3 2017, with Saudi Arabia and China experiencing the largest falls; in contrast, the increase in exports to the EU reflected increases in exports to Germany and the Netherlands.
UK imports of services increased from £19,103 million to £19,759 million between Quarter 2 2017 and Quarter 3 2017, reflecting increases in services imports from the EU, non-EU Europe and Africa.
The EU made the largest contribution to the overall £656 million increase in imports in Quarter 3 2017, with Ireland and France seeing the largest increases; partially offsetting these increases were imports from the Americas, mainly due to falls in the US.
The decline in total services exports and increase in imports indicates that the UK's trade in services balance surplus fell in Quarter 3 2017, although figures presented will be affected by seasonal factors and exclude trade related to industries including the banking, travel and transport industries. | 


No comments:
Post a Comment