| Today marks the 60th edition of Family Spending. Family Spending provides an insight into the spending habits of UK households, broken down by household characteristics and types of spending. Average weekly household spending rose to £554.20 in the financial year ending 2017, and spending differed by more than £200 when comparing UK countries and English regions. Households in the South East were the top UK spenders on pets and pet food, spending an average of £5.70 a week compared to the UK average of £4.80 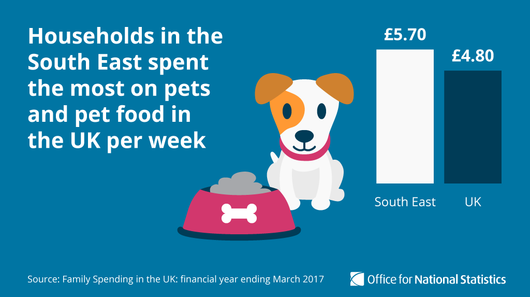 Household spending on takeaways in the South West was £3.70 a week - the lowest spending on takeaways in the UK. 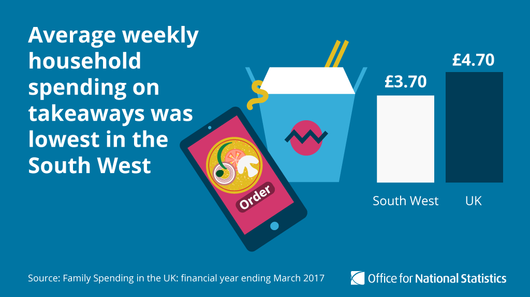 London households spent the most on fresh fruit and veg in the UK at £10.20 per week vs UK average of £7.70 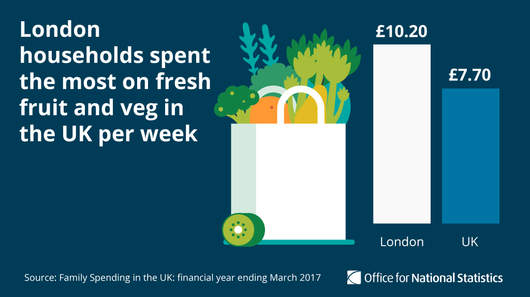 On average, do households spend the most on tea and coffee or chocolate per week? How about meals out vs clothing? Find out what households spend the most on with our interactive 
We're celebrating 60 years of Family Spending – thank you to the 375,000 households that have taken part in the Living Costs and Food Survey and its predecessors since 1957. Happy birthday, Family Spending!  Our household spending reports are now celebrating their diamond jubilee. Here, Joanna Bulman explains what's changed down the years – and a little of what hasn't. The percentage of total household spending on tobacco has dramatically decreased over 60 years, from 6% of total weekly spending in 1957 to 1% in 2016/17. The percentage of total household spending on food has more than halved from 33% in 1957 to 16% in 2016/17. See how our spending has changed over 60 years. | 


No comments:
Post a Comment